Deeper insights create richer experiences.
Understand and improve customer interactions, driven by data.
Get whitepaper Book a demoUnderstand and improve customer interactions, driven by data.
Get whitepaper Book a demo
Track and analyze customer interactions
Root cause analysis
Diagnose the flow execution metrics to identify areas of improvement.
Real-time performance view
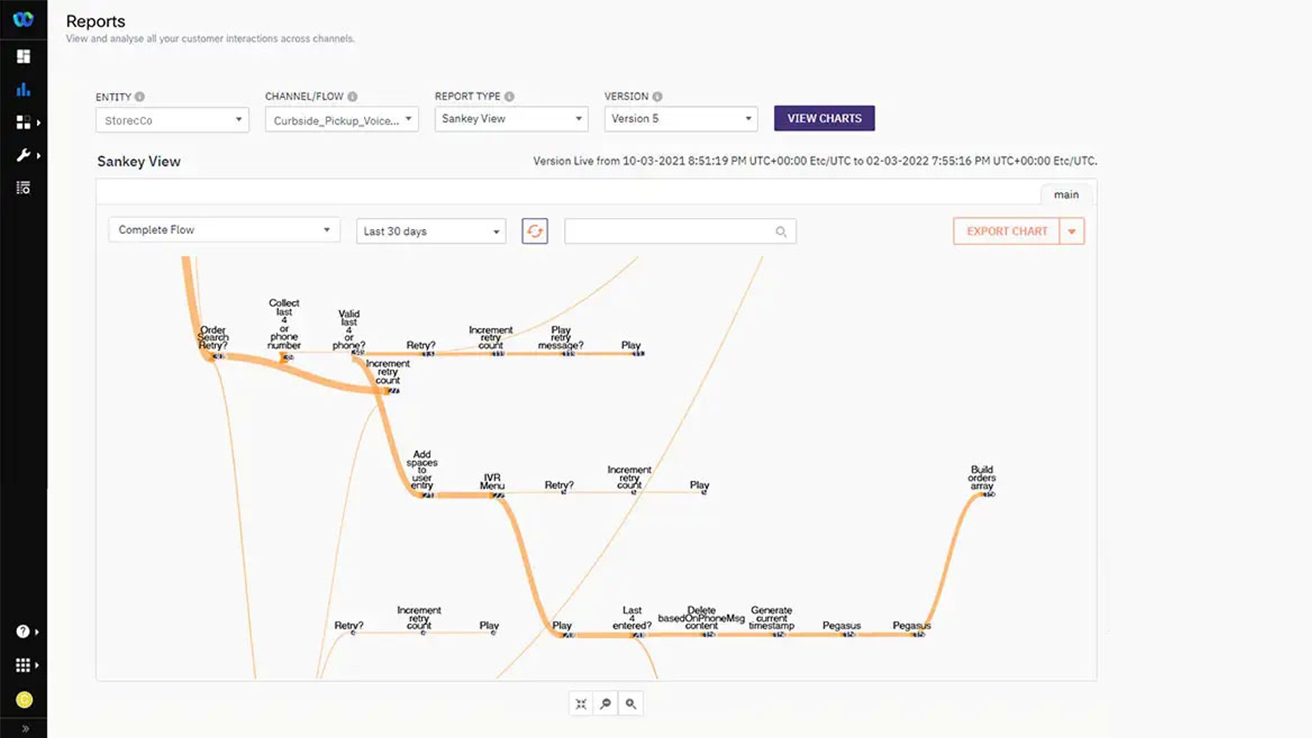
Visualize how the customer journey is performing in real-time using bi-directional Sankey charts and comprehensive dashboards.
Monitor communications operations in real-time
Watchtower Monitoring Dashboard
Use the Watchtower Monitoring Dashboard to monitor operations and observe Transactions Per Second (TPS) quota utilization for the Messaging API and Event API.
Adjust limits to fit needs
Track rejections due to TPS limits and reach out to the support team to increase or decrease throughput limits as required.
Webex Connect.
Rapidly automate customer interactions across multiple channels. Learn how Webex Connect can help you manage an increasingly complex communications landscape and deliver a differentiated customer experience.
Key features.
-
Descriptive analytics
Use the embedded BI capability to perform multi-dimensional analysis and data visualization.
-
Segment analysis
Create segments and sub-segments to analyze flows at a granular level.
-
Goal tracking
Track end goals and outcomes in relation to engagement patterns.
-
Node-level analytics
Understand execution time at a node-level to identify potential improvements.
-
Sankey charts
Access multi-level path analytics to know what's working and what's not.
-
Time-bound analysis
Configure custom reports and analyze customer interactions for different time periods.

